# Reports
{% hint style="info" %}
Reports Module is only available for the Business plan and above. Please upgrade or subscribe to the Business or Enterprise Plan if you wish to use this feature.
{% endhint %}
This module provides more insights into your workforce's performance on the platform and helps businesses to make informed decisions based on information gathered through the platform.
Data shown in the reports are according to the Workspace’s [Timezone settings](/ismessenger/workspace-setting/managing-a-workspace.md) so ensure that you have set your preferred timezone.
## Getting Here
{% hint style="warning" %}
This module is accessible by Owner and Manager only!
{% endhint %}
This module can be accessed from the side navigation menu under the menu item, **Reports.**

This module will provide more insights on your workforce's performance on the platform and can help a business to make informed decision based on the information gathered through the platform.
{% hint style="danger" %}
This feature is under Beta testing and will soon be available to Business and Enterprise plans only!
{% endhint %}
{% hint style="info" %}
Be sure to update your space's [Timezone settings](/ismessenger/workspace-setting/general.md#setting-timezone) so the data shown is according to your preferred timezone.
{% endhint %}
## **Report Tabs**
In this module, there are 9 reporting tabs. Each tab consists of metrics, charts and listings related to the entity. The tabs are as follows:
* [Conversations](/ismessenger/modules/untitled.md)
* [Responses](/ismessenger/modules/untitled.md)
* [Resolutions](https://help.respond.io/dashboard-reporting/reports-resolutions)
* [Messages](/ismessenger/modules/untitled.md)
* [Contacts](/ismessenger/modules/untitled.md)
* [Assignments](/ismessenger/modules/untitled.md)
* [Leaderboard](/ismessenger/modules/untitled.md)
* [Users](/ismessenger/modules/untitled.md)
* [Broadcasts](/ismessenger/modules/untitled.md)
Each tabs consists of metrics, charts and listing related to the entity.
## Report Filters

Each tab has its own set of report filters that enable you to perform in-depth analysis or create insightful information from the reports.
Some filters are only applicable to certain overviews in the report tabs. In this case, those overviews will be empty and indicated as not applicable.
The filters applied are retained on the user level and not affected by changes made by other users so that you can pick up from where you left off.
### Report Features
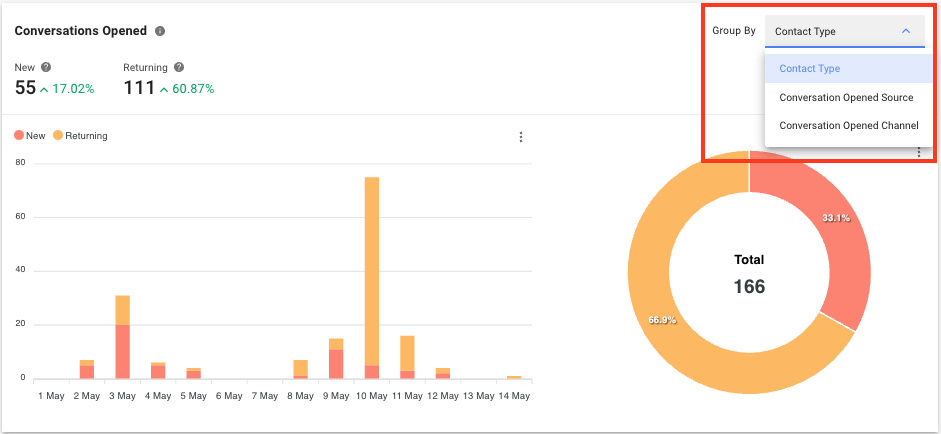
**Group By**
For charts that contain multiple breakdown options, you can click the *Group By* drop-down list to view the options available.
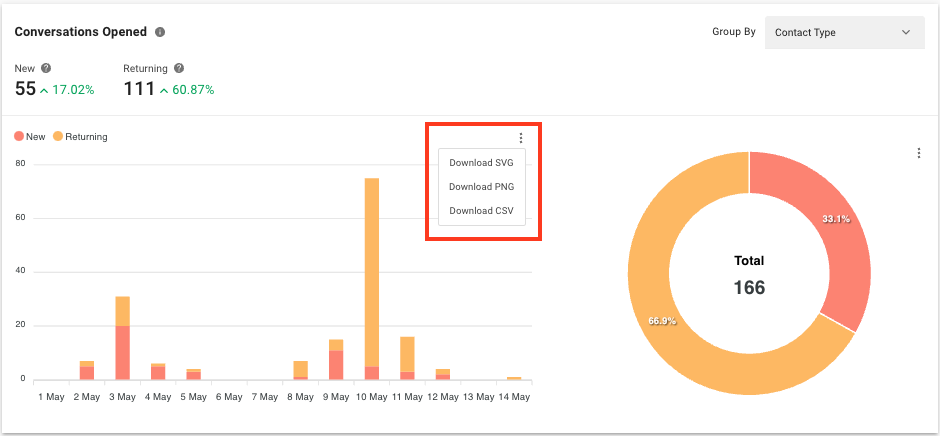
**Download Charts**
Click the 3 dots icon next to the chart to download the selected chart. There are 3 options available: **SVG**, **PNG** and **CSV**.
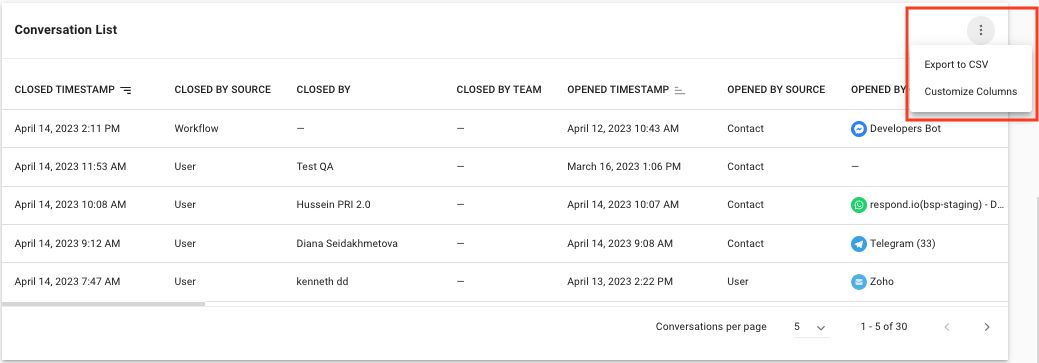
### **Export Data to CSV and Customize Columns**
Click the 3 dots icon next to a list of data to export the list to a CSV file. You may also choose to display or hide columns to view only details that are relevant to you. Your selections will not affect the viewing of other users.
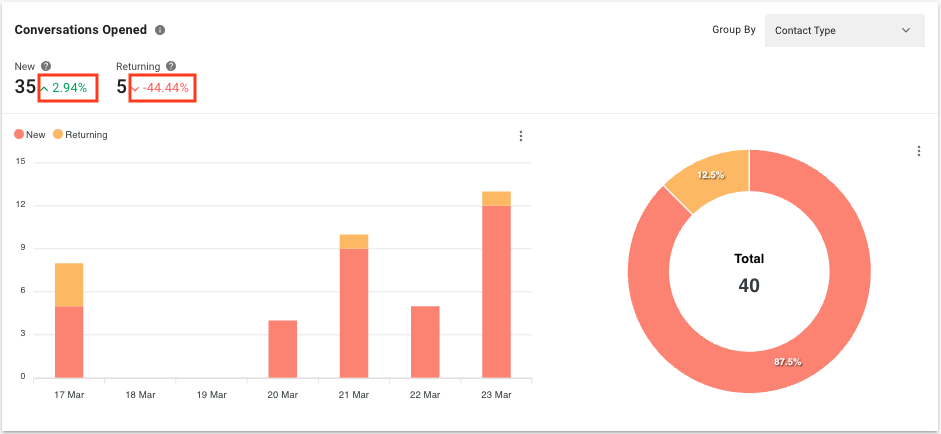
### **Percentage of Difference**
On the right side of the metrics shown in some of the charts, you can see a percentage of difference. The value is compared to the same period prior to the selected period. If the selected period is the last 7 days (e.g. 17 Mar - 23 Mar), the percentage of difference is compared to the 7 days prior to the last 7 days (e.g. 10 Mar - 16 Mar).
{% embed url="" %}
### FAQ and Troubleshooting
**Can I view the historical data in the Reports module after upgrading to the Business or Custom plan from the Team Plan?**
Yes, you can view the data in the Reports module from one year ago, starting from the date of the upgrade to the Business or Custom Plan.
**Why is the timestamp shown differently when downloading a CSV file from the Reports module?**
The timestamp is shown in milliseconds. You can convert the timestamp to minutes using the following formula:\
\
`milliseconds / 1000 / 60 = minutes`\
\
For example, if the timestamp is 900000 milliseconds, to convert it to minutes, you would calculate:\
\
`900000 / 1000 / 60 = 15 minutes`
---
# Agent Instructions: Querying This Documentation
If you need additional information that is not directly available in this page, you can query the documentation dynamically by asking a question.
Perform an HTTP GET request on the current page URL with the `ask` query parameter:
```
GET https://docs.is-messenger.com/ismessenger/modules/reports.md?ask=
```
The question should be specific, self-contained, and written in natural language.
The response will contain a direct answer to the question and relevant excerpts and sources from the documentation.
Use this mechanism when the answer is not explicitly present in the current page, you need clarification or additional context, or you want to retrieve related documentation sections.