# Reports: Leaderboard
The Leaderboard report provides a visual representation of data that shows how users or teams are performing relative to each other on a specific metric. Managers can use these metrics to highlight exceptional performing agents or teams, or identify agents or teams that requires improvement.
Each metric ranks top performers at the top of the list and only the top 10 users or teams will be listed on the chart. Use filters to compare specific set of users or teams.
## Getting Here
Navigate to the **Reports** module and click **Leaderboard**.
### Filters
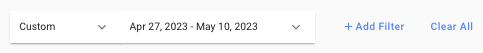
* Frequency and date — Select a date range from the drop-down list to be applied to the report. Alternatively, you can define the date range by frequency. The following options are available:
* Today
* Yesterday
* Last 7 Days
* Last 14 Days
* Last 30 Days
* This Month
* Last Month
* +Add Filter — You can refine the view of the report components by adding more filter(s). The following filters are available:
* User - Use this to view the performance of a specified user(s).
* Team - Use this to view the performance of a specified team(s).
* Clear All — You can use this option to reset the filters to the default selections.
{% hint style="warning" %}
You may encounter a chart with the following message displayed:\
\- *The selected filter(s) are not applicable here*: This means the filter(s) you have selected are not applicable to the chart.\
\- *The selected filter(s) have no applicable data*: This means no data is available for the selected filter(s), for e.g. the chart is new and only available at a date later than the selected date range.
{% endhint %}
## Report Components
By default, only the top 10 users or teams will be shown in the charts.
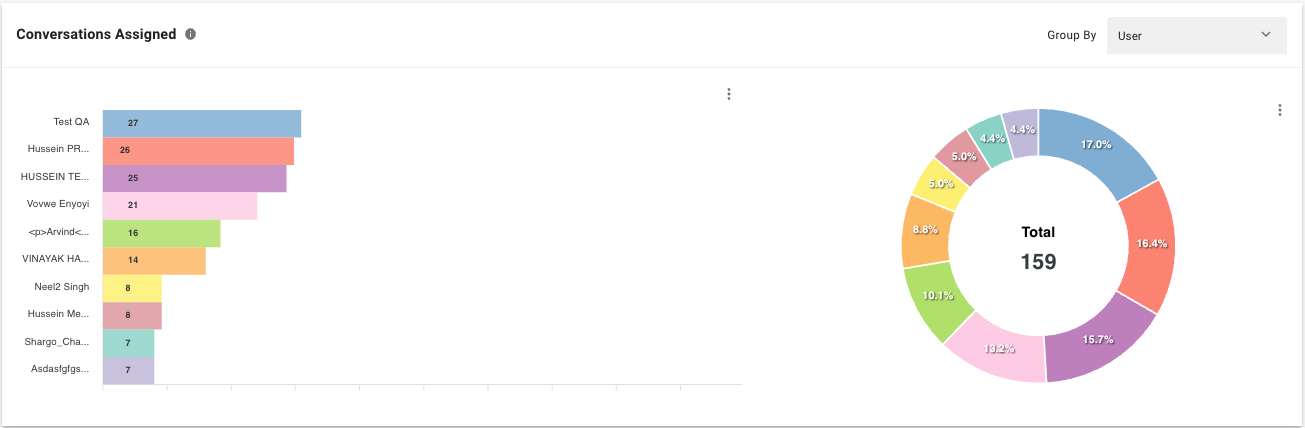
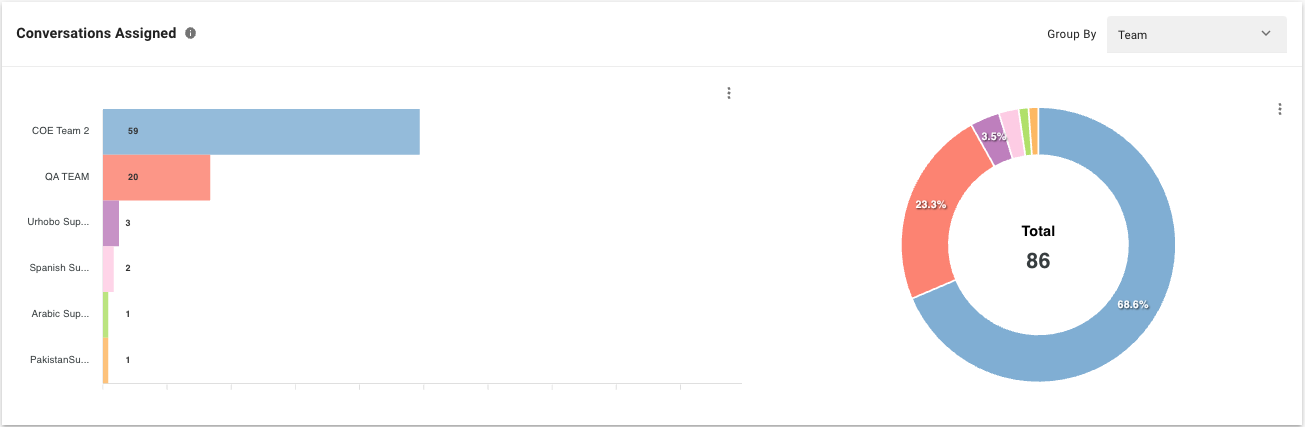
### **Conversations Assigned (by User or Team)**
**Metric**
The users’ or teams’ number and percentage of conversations assigned within the selected period. The number of assignments is added every time a conversation is assigned to a user or team.
**Bar Chart**
Compares the users’ or teams’ number of conversations assigned within the selected period.
**Pie Chart**
The users’ or teams’ percentage and total number of conversations assigned within the selected period.
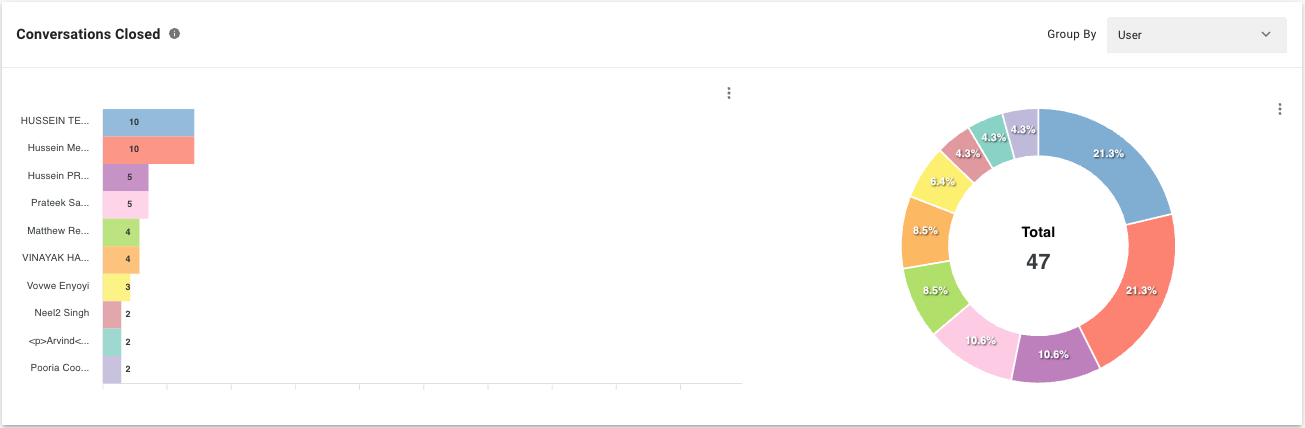
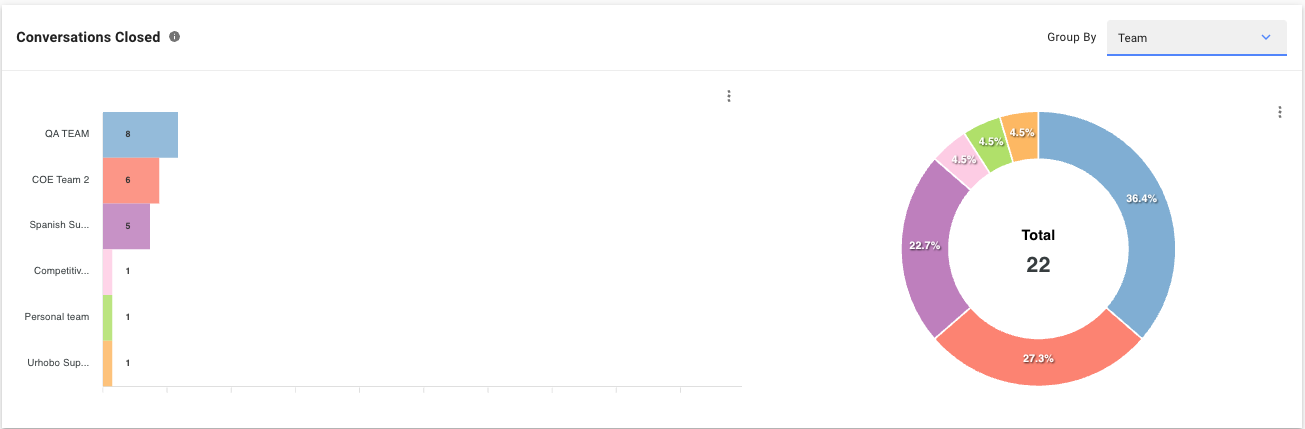
### **Conversations Closed by User or Team**
**Metric**
The number and percentage of conversations closed by users or teams within the selected period. The number of conversations is added every time a conversation is closed by a user or team.
**Bar Chart**
Compares the users' or teams' number of conversations closed within the selected period.
**Pie Chart**
The users' or teams' percentage and total number of conversations closed by users or teams within the selected period.
The next few charts compare users’ or teams’ performance on metrics related to response and resolution time. Use the drop-down menu on the top right of each chart to switch between group by User and group by Team views.
### **Average First Response Time**
**Metrics**
The average amount of time taken by users or teams to send the first response to Contacts from the time when the conversations were opened, within the selected period. This metric is attributed to the user who provided the first response.
### **Average First Assignment to First Response Time**
**Metrics**
The average amount of time taken by users or teams to send the first response to the Contact from the time when the conversation was first assigned, excluding the time to assignment. This metric is attributed to the user who provided the first response.
### **Average Response Time**
**Metrics**
The average amount of time taken by users or teams to respond to Contacts within the selected period. This metric includes all responses given by the user in all conversations, regardless of the assignee of the conversations.
### **Average Resolution Time**
**Metrics**
The average amount of time taken by users or teams to close conversations from the time when the conversation was opened, within the selected period. This metric is attributed to the user who closed the conversation.
### **Average First Assignment to Close Time**
**Metrics**
The average amount of time taken by users or teams to close conversations from the time when the conversation was first assigned, excluding the time to assignment. This metric is attributed to the user who closed the conversation.
**Average Last Assignment to Close Time**
**Metrics**
The average amount of time taken by users or teams to close conversations from the time when the conversation was last assigned to the user, within the selected period. This metric is attributed to the user who closed the conversation.
---
# Agent Instructions: Querying This Documentation
If you need additional information that is not directly available in this page, you can query the documentation dynamically by asking a question.
Perform an HTTP GET request on the current page URL with the `ask` query parameter:
```
GET https://docs.is-messenger.com/ismessenger/modules/reports/reports-leaderboard.md?ask=
```
The question should be specific, self-contained, and written in natural language.
The response will contain a direct answer to the question and relevant excerpts and sources from the documentation.
Use this mechanism when the answer is not explicitly present in the current page, you need clarification or additional context, or you want to retrieve related documentation sections.