Reports: Messages
The Messages report helps you gain insights into overall messages performance. This report helps you to understand:
The volume of incoming messages from different channels.
The number of outgoing messages sent from the platform by channel, source, type and sub-type.
The outgoing messages delivery status (Sent, Delivered, Read, Failed) on the platform.
Getting Here
Navigate to the Reports module and click Messages.
Filters

Frequency and date — Select a date range from the drop-down list to be applied to the report. Alternatively, you can define the date range by frequency. The following options are available:
Today
Yesterday
Last 7 Days
Last 14 Days
Last 30 Days
This Month
Last Month
+Add Filter — You can refine the view of the report components by adding more filter(s). The following filters are available:
Channel
Contact
Outgoing Message Source
Outgoing Message Type
Team
User
Broadcast Name
Clear All — You can use this option to reset the filters to the default selections.
You may encounter a chart with the following message displayed: - The selected filter(s) are not applicable here: This means the filter(s) you have selected are not applicable to the chart. - The selected filter(s) have no applicable data: This means no data is available for the selected filter(s), for e.g. the chart is new and only available at a date later than the selected date range.
Report Components
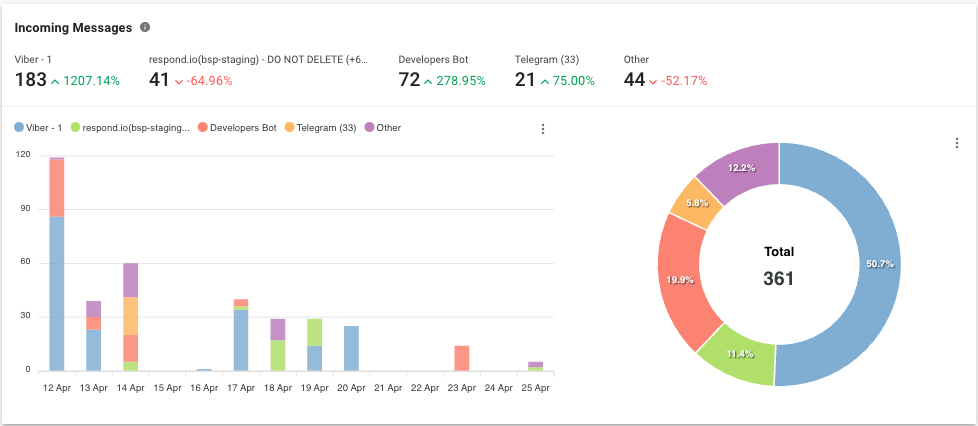
Incoming Messages
Metric
The number of messages received within the selected period by channel.
Bar Chart
The number of messages received within the selected period by channel.
Pie Chart
The percentage and total number of messages received within the selected period by channel.
Outgoing Messages
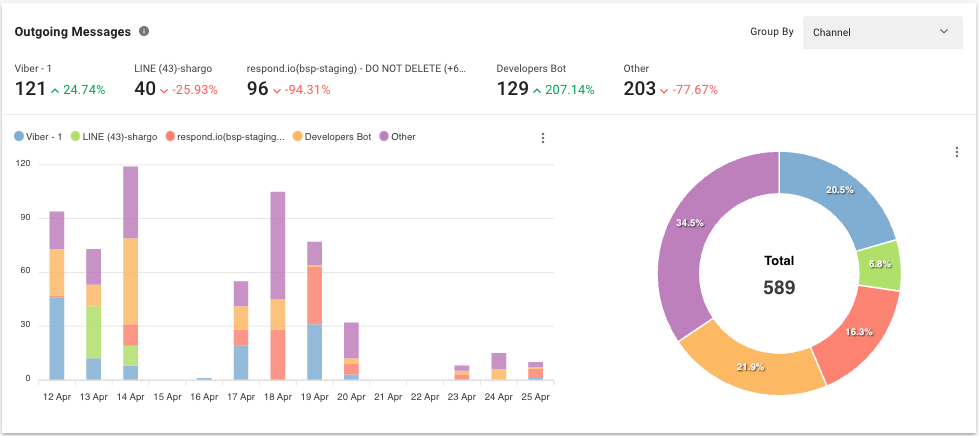
The chart can be grouped by Channel, Outgoing Message Source, Outgoing Message Type and Outgoing Message Sub-type.
Outgoing Messages by Channel
Metric
The number of messages sent within the selected period by channel.
Bar Chart
The number of messages sent within the selected period by channel.
Pie Chart
The percentage and total number of messages sent within the selected period by channel.
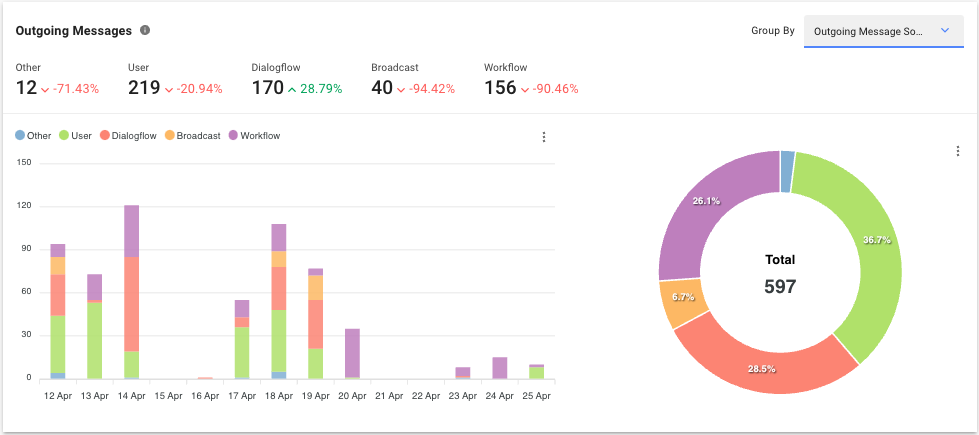
Outgoing Messages by Source
Metric
The number of messages sent within the selected period by source.
Messages can be sent via the following ways:
Source
Description
User
The message was sent by a user from the Messages module.
Bot
The message was sent using DialogFlow integration.
Broadcast
The message was sent using the Broadcast feature in the Workspace.
Workflows
The message was sent from a Workflow step.
Developer API
The message was sent from Developer API call.
Zapier
The message was sent from Zapier action.
Make
The message was sent from Make action.
Echo Message
The message was sent from other platform or channel.
Bar Chart
The number of messages sent within the selected period by source.
Pie Chart
The percentage and total number of messages sent within the selected period by source.
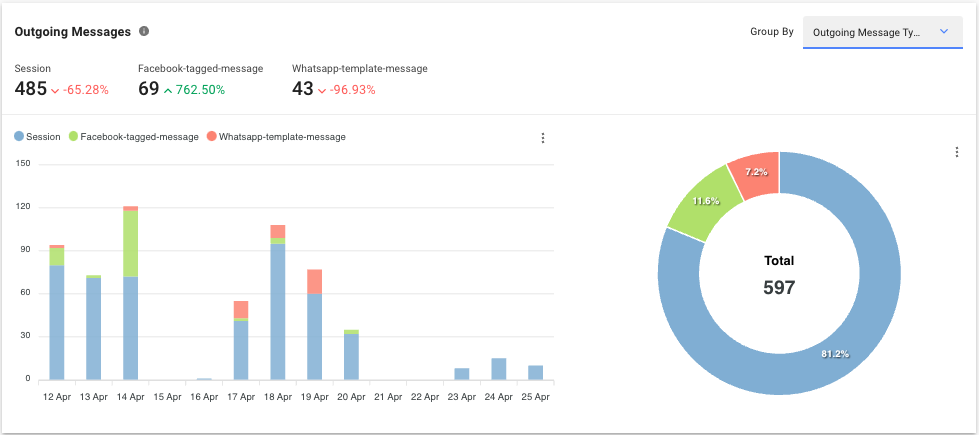
Outgoing Messages by Type
Metric
The number of messages sent within the selected period by type.
There are 3 types of outgoing messages:
Type
Description
Session
The message sent was a regular message.
Facebook Message Tag
The message sent was tagged with Facebook Tags.
WhatsApp Message Templates
The message was sent using a WhatsApp Message Template.
Bar Chart
The number of messages sent within the selected period by type.
Pie Chart
The percentage and total number of messages sent within the selected period by type.
Outgoing Messages by Sub-type
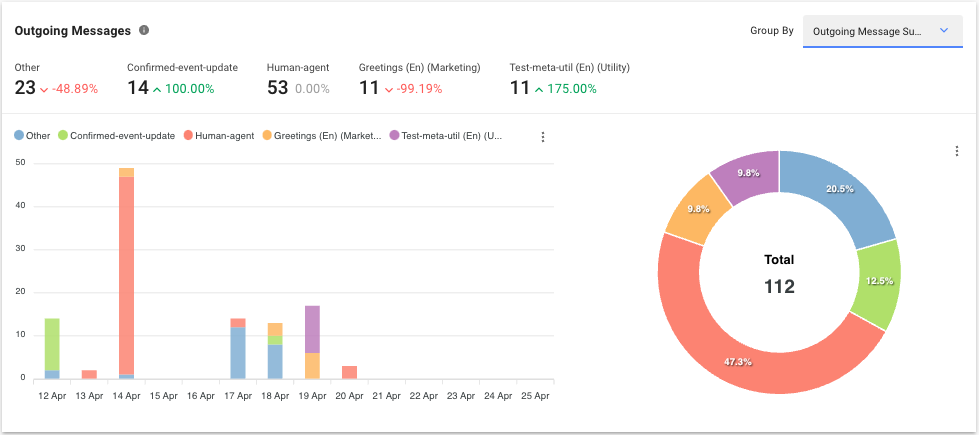
Metric
The number of messages sent within the selected period by sub-type. Sub-type is only applicable to Facebook channel when a Message Tag is sent and WhatsApp channel when a WhatsApp Message Template is sent.
For Facebook Message Tags - The metric is broken down by the Facebook Tags used to send the message.
For WhatsApp Message Template - The metric is broken down by the name of template used to send the message.
Bar Chart
The number of messages sent within the selected period by sub-type.
Pie Chart
The percentage and total number of messages sent within the selected period by sub-type.
Outgoing Messages Delivery (Linear)
- The tracking of messages delivery status is only up to 30 days. So for an example, if a message gets read only after 30 days, the delivery status will no longer be updated to Read. - If Contacts have turned off Read Receipts on the WhatsApp app's privacy setting, messages they have read will not be reflected in the Read metric. Instead, they will be reflected in the Sent and Delivered metrics. This may cause a discrepancy between the number of Read and Delivered messages.
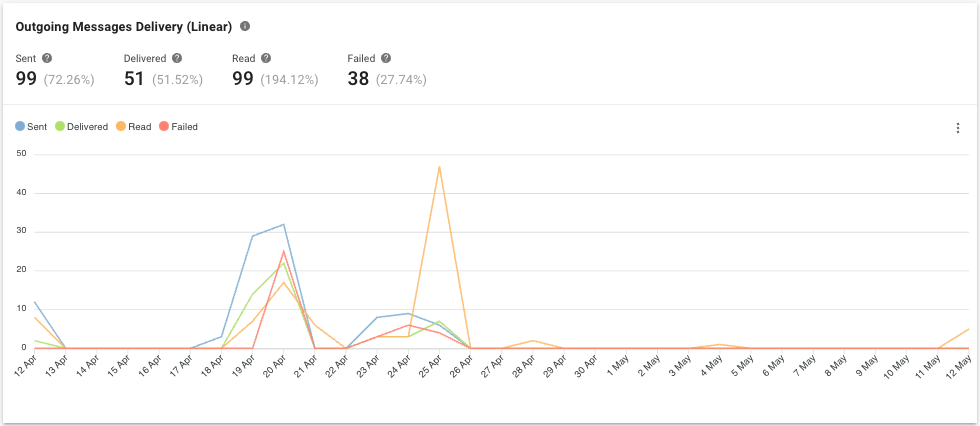
Metric
The number and percentage of outgoing messages within the selected period by delivery status i.e. Sent, Delivered, Read and Failed.
Line Chart
The number of outgoing messages within the selected period by delivery status i.e. Sent, Delivered, Read and Failed.
Incoming Message List
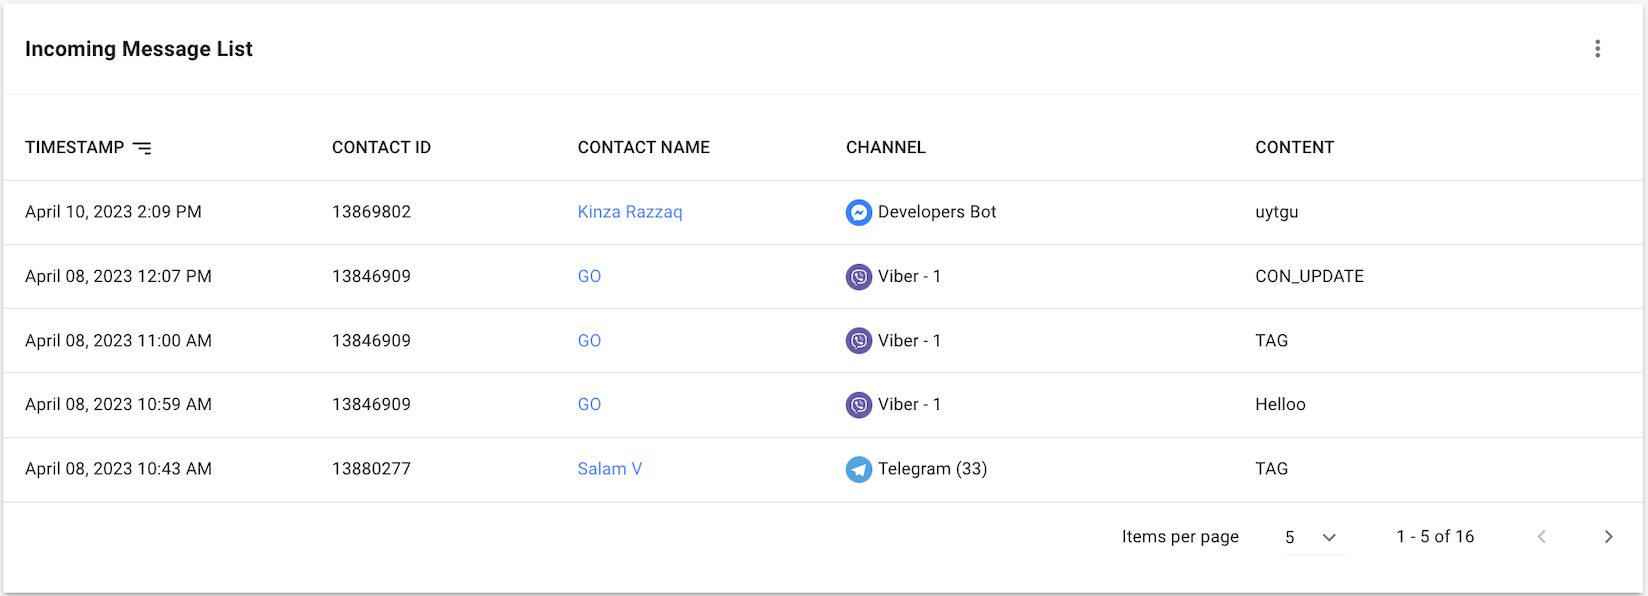
From this list, you can review the details of each message received from a Contact.
Learn more about each column in the following table:
Table Headers
Description
Timestamp
The date and time the message was received.
Contact ID
The ID of the Contact from whom the message was received.
Contact Name
The name of the Contact from whom the message was received.
Channel
The channel on which the message was received.
Content
The content of the message.
Reports table has a limitation of generating a maximum of 10,000 row of results. If you need more data, consider using Data Export.
Outgoing Message List
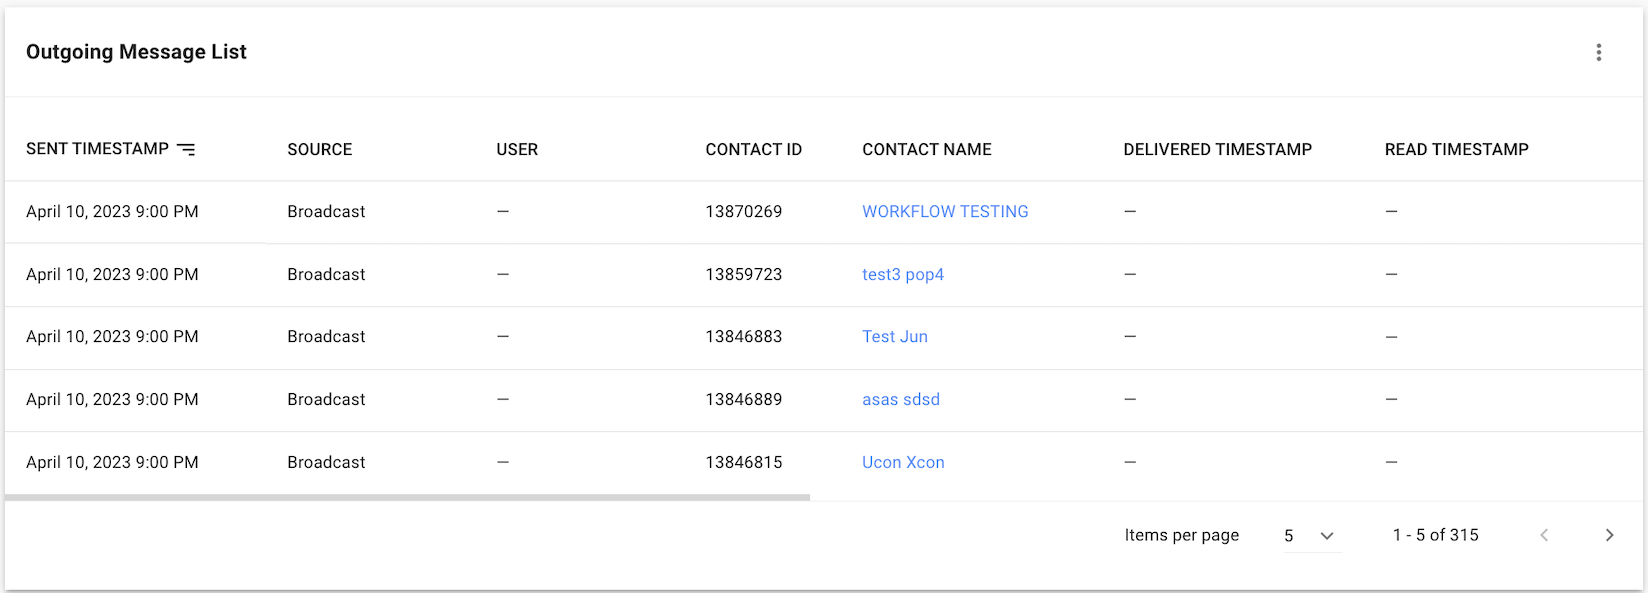
From this list, you can review the details of each message sent to a Contact.
Learn more about each column in the following table:
Table Headers
Description
Sent Timestamp
The date and time the message was sent.
Source
The source of how the message was sent.
User
The user who sent the message. It is only applicable when the source is User.
Contact ID
The ID of the Contact to which the message was sent.
Contact Name
The name of the Contact to which the message was sent.
Delivered Timestamp
The date and time the message was read. Any change to the delivery status after 30 days will no longer be reflected here.
Read Timestamp
The date and time the message was read. Any change to the delivery status after 30 days will no longer be reflected here.
Channel
The channel on which the message was sent.
Type
The type of message sent.
Sub Type
The sub-type of message sent.
Content
The content of the message.
Reports table has a limitation of generating a maximum of 10,000 row of results. If you need more data, consider using Data Export.
Failed Message Log
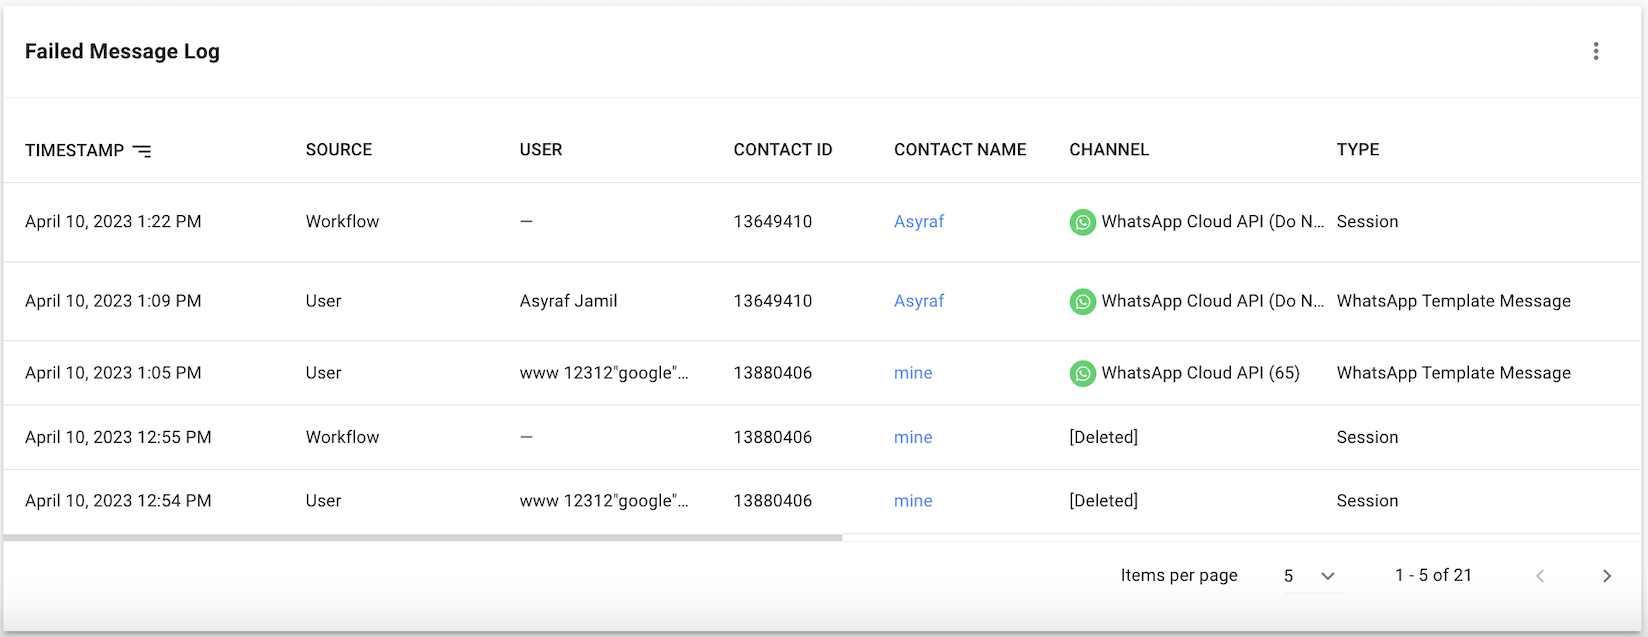
From this log, you can review the details of each message that failed to be sent to a Contact.
Table Headers
Description
Timestamp
The date and time the message failed to be sent.
Source
The source of the message.
User
The user who tried to send the message. It is applicable only when the source is User.
Contact ID
The ID of the Contact to whom the message failed to be sent.
Contact Name
The name of the Contact to whom the message failed to be sent.
Channel
The channel on which the message failed to be sent.
Type
The type of the message.
Sub Type
The sub-type of the message.
Content
The content of the message.
Error
The error that caused the failure to send.
Reports table has a limitation of generating a maximum of 10,000 row of results. If you need more data, consider using Data Export.
Last updated